Probes, history, incidents, and alerts in one place. Read-only by design — no PII, no ad-hoc SQL.
01
Always-on probes
A dedicated worker checks every store on a five-minute loop — portal SSH, host metrics, MySQL, services, commerce APIs, and optional CloudWatch. One flaky reading won’t page anyone; sustained failures will.
Forge SSH, nginx, php-fpm, queue workers
MySQL ping and allowlisted status keys
HTTPS, CDN, Shopify, UltraCart, Maropost
RDS CPU, connections, and SQS depth
02
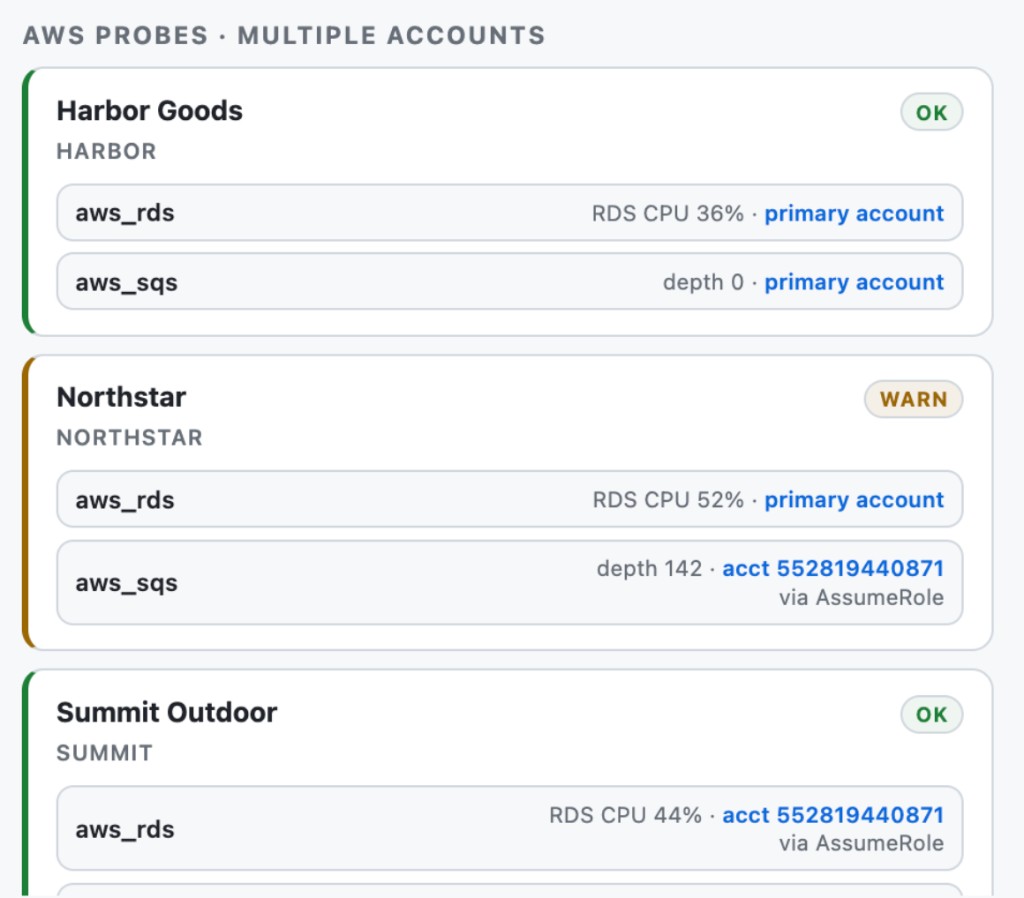
Multi-account AWS
Stores don’t always live in one AWS account. infraMonitor assumes a read-only IAM role per store when RDS or SQS lives elsewhere — same dashboard, no credential sprawl.
Default account for co-located resources
Cross-account AssumeRole for external queues and databases
Per-store AWS account and IAM role mapping
Probe messages show which account answered
03
Metrics & uptime history
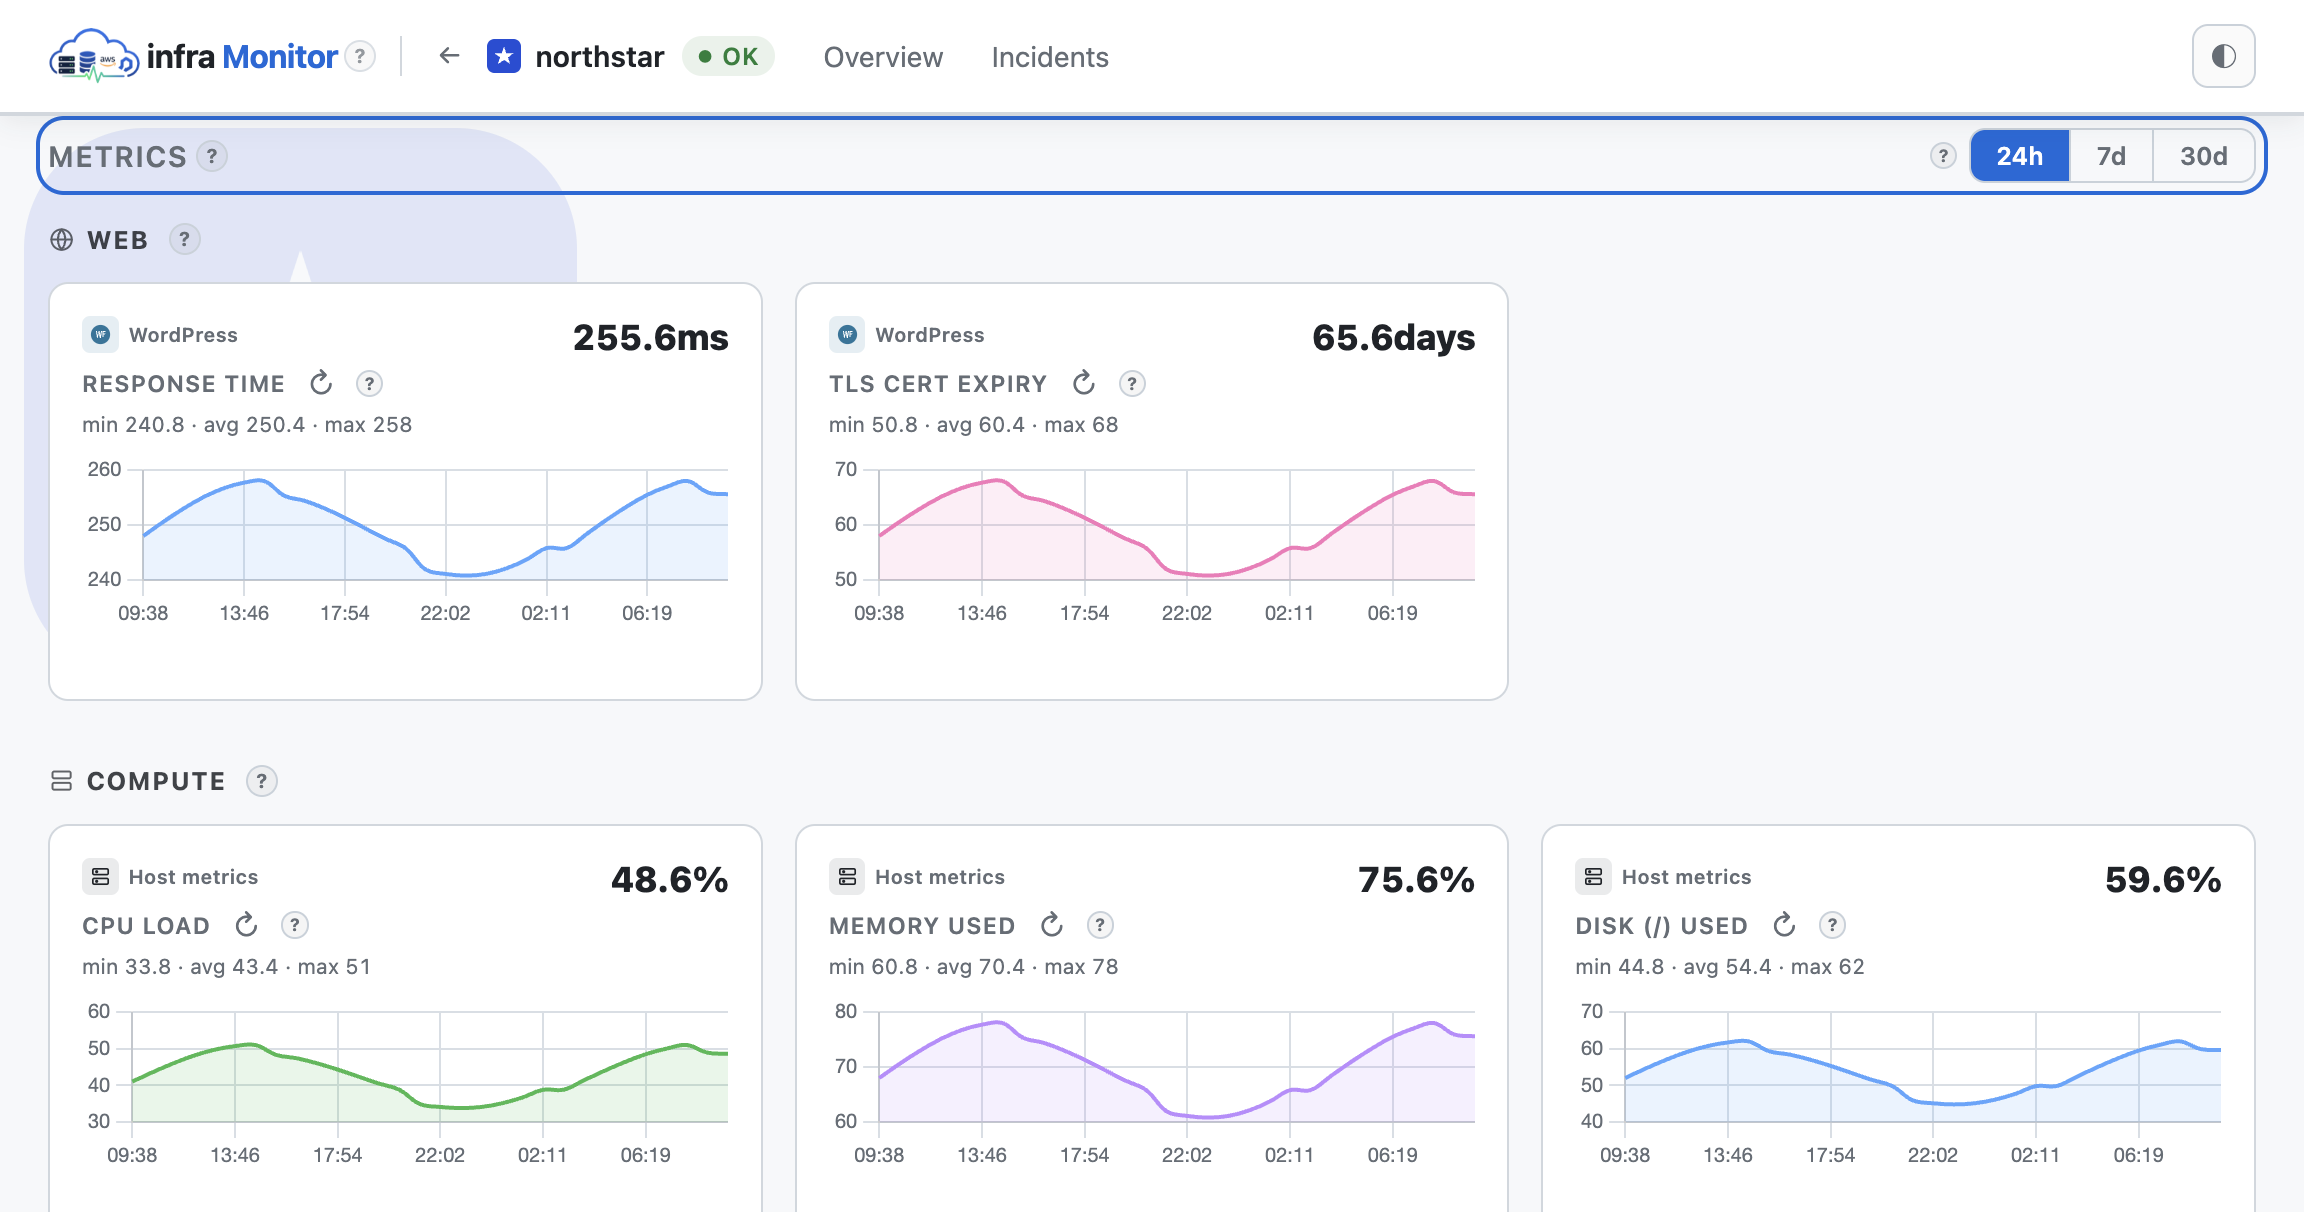
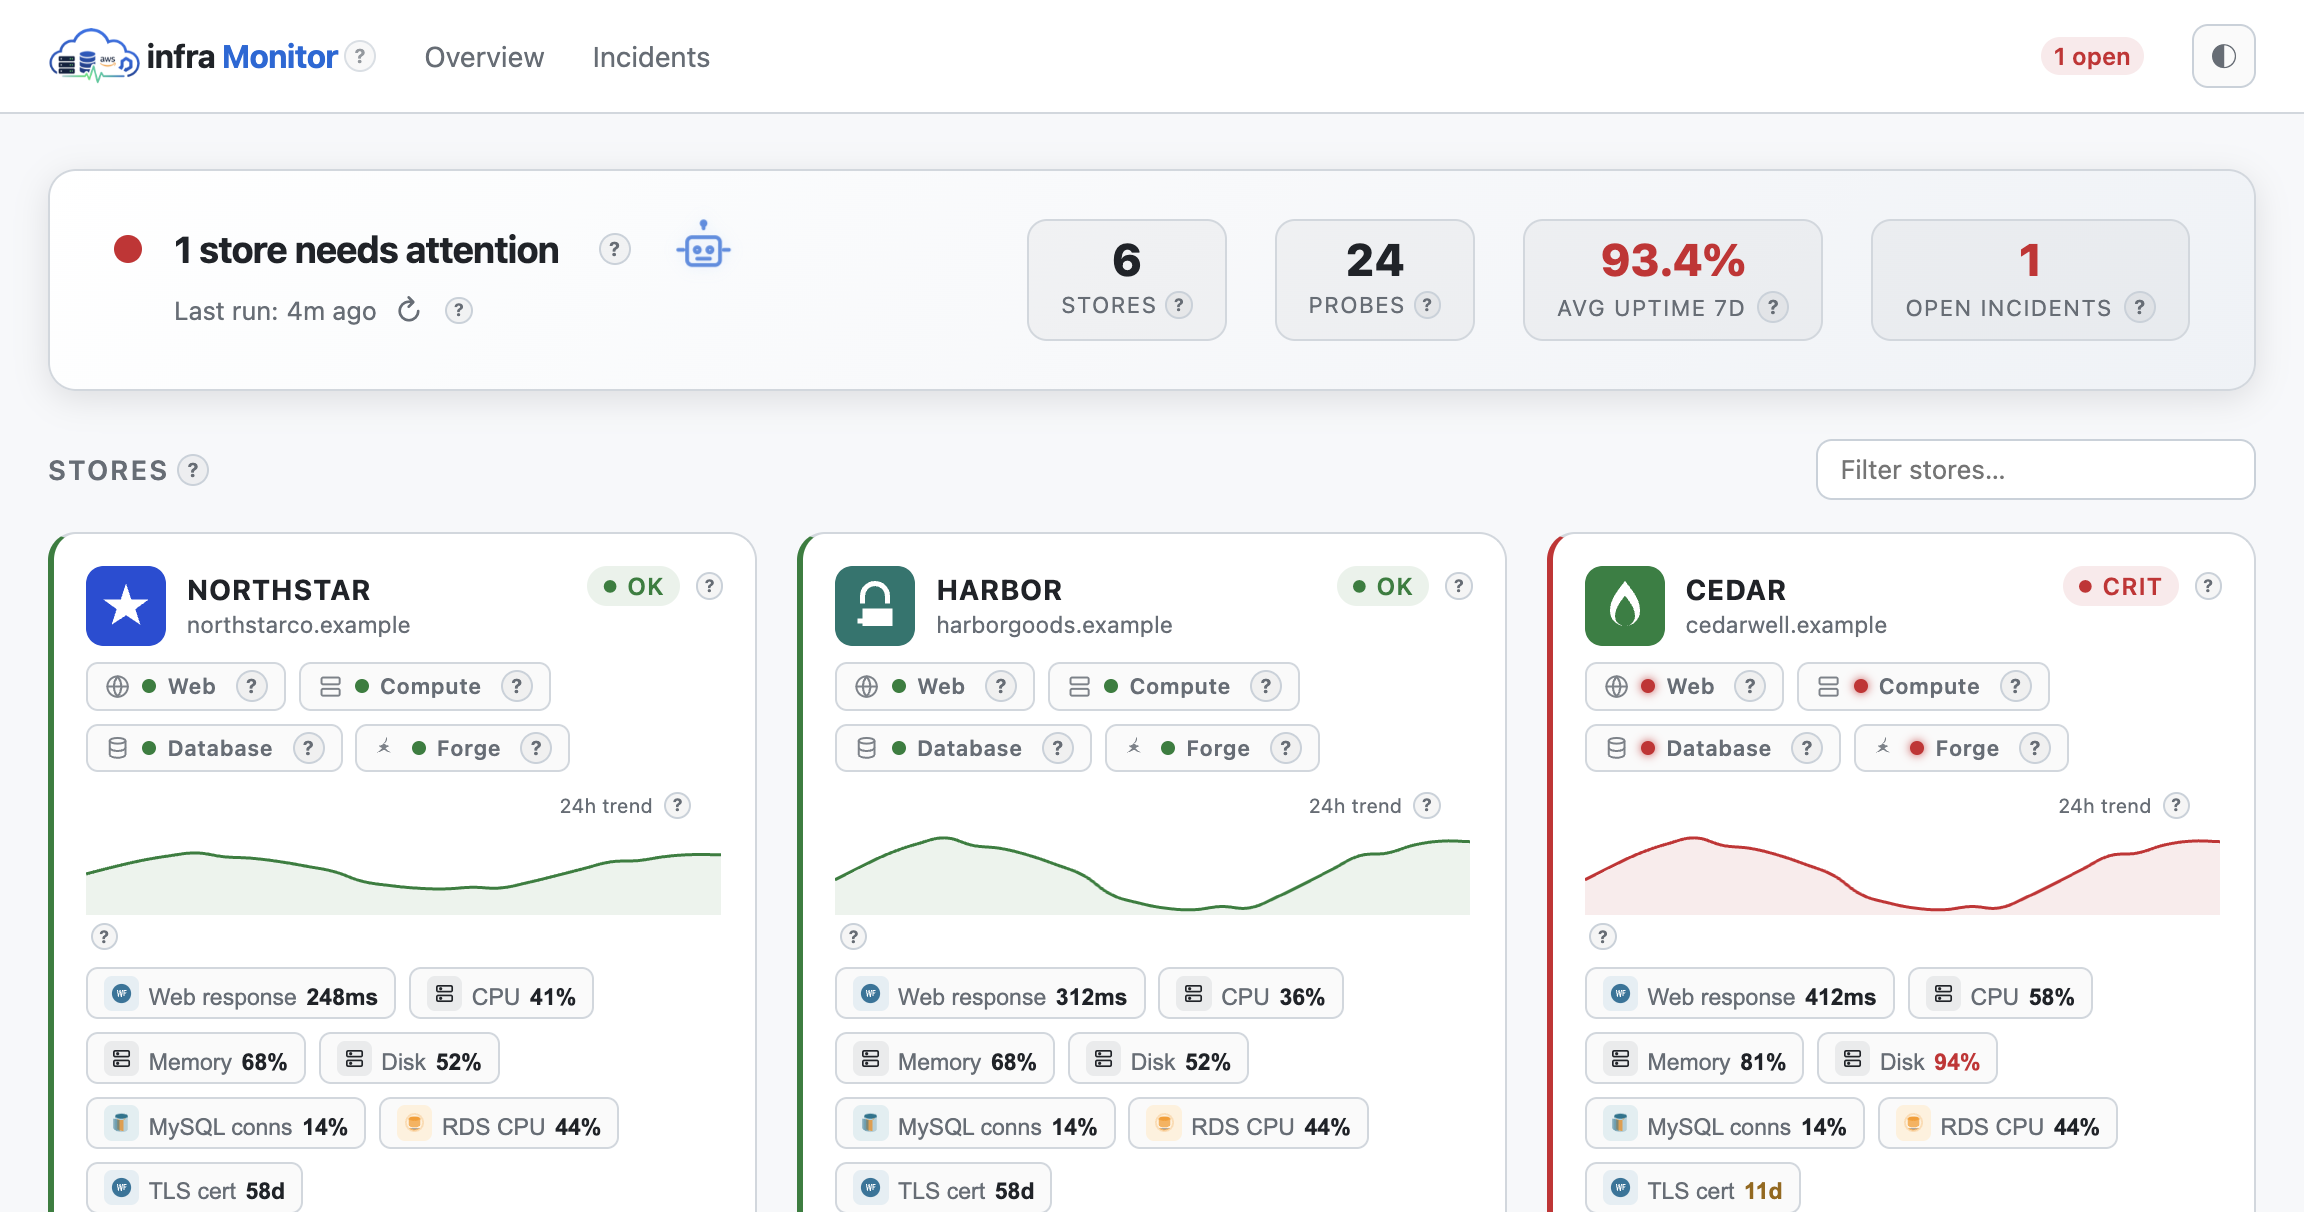
Every probe run is stored in SQLite on the monitor host — not your customer databases. Review trends per store from the last 24 hours up to 30 days, with sparklines on the fleet overview.
Response time, CPU, disk, memory, TLS expiry
Per-metric charts with range picker
7-day uptime % on every store card
History backed up to S3 daily
04
Incidents & Slack alerts
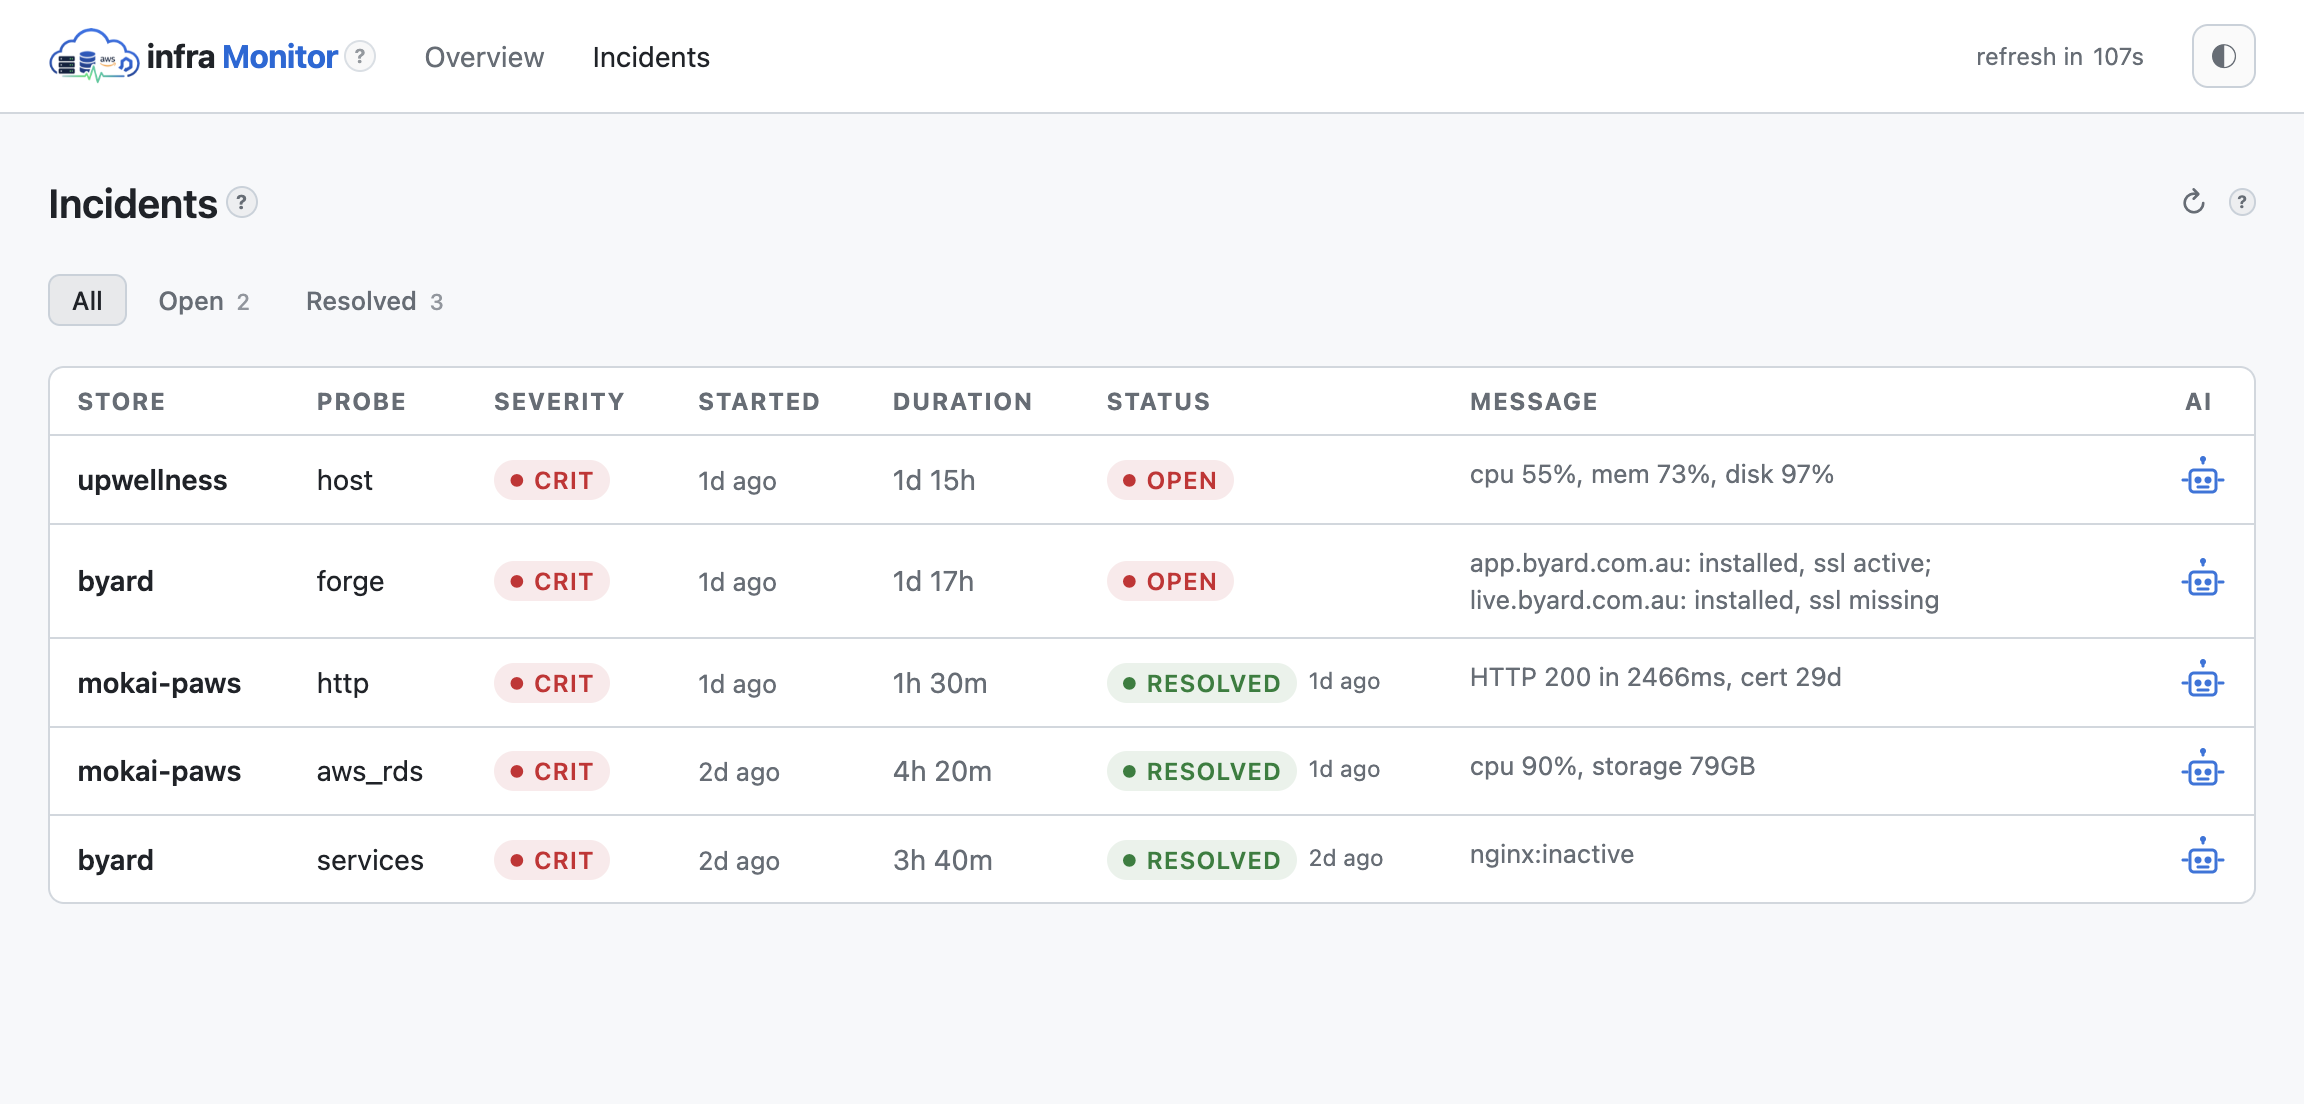
When probes fail repeatedly, an incident opens automatically with timestamps, severity, and the last error message. Slack pings the team on open and resolve — grouped when several stores share the same root cause.
Configurable fail/OK streak thresholds
Open and resolved incident log
Slack links straight to store or probe
Maintenance windows to suppress noise during deploys
05
AI-assisted triage
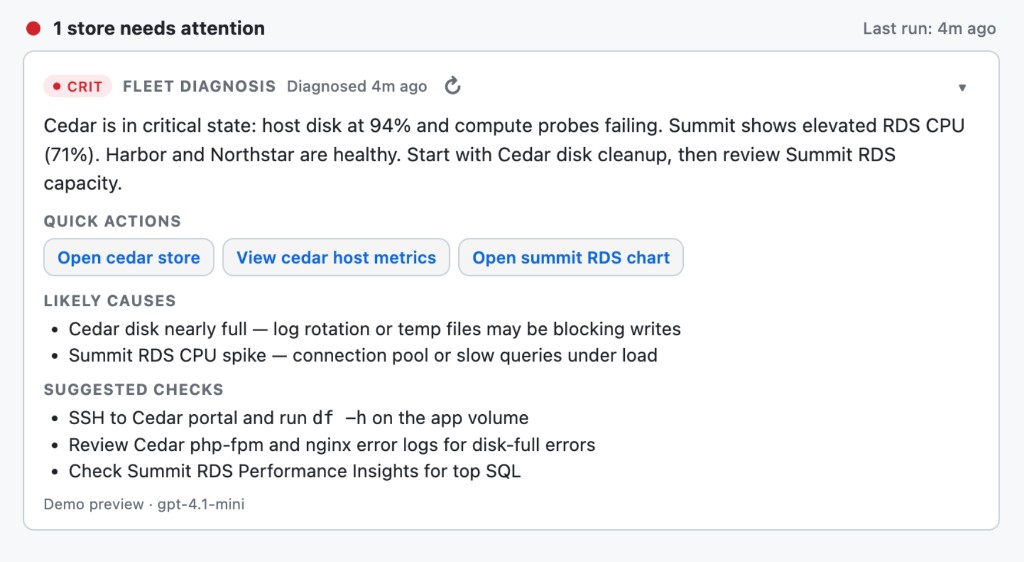
One click summarizes failing probes, likely causes, and suggested checks — on incidents, noisy store status, or the fleet hero. Built from redacted probe snapshots, not customer data.
Fleet-wide diagnosis from the overview hero
Per-incident and per-store explain panels
Quick-action links to charts and store pages
Recheck probes and refresh the analysis
06
Team access
Sign in with your company Google account — no shared passwords, no separate infraMonitor credentials. Access is restricted to approved email domains for Sprint Media, TAD, and UpWellness teams.
Google SSO behind Cloudflare Access
Domain allowlist per organization
Same login for dashboard and incident links
Theme preference saved per browser
07
Ops-safe by design
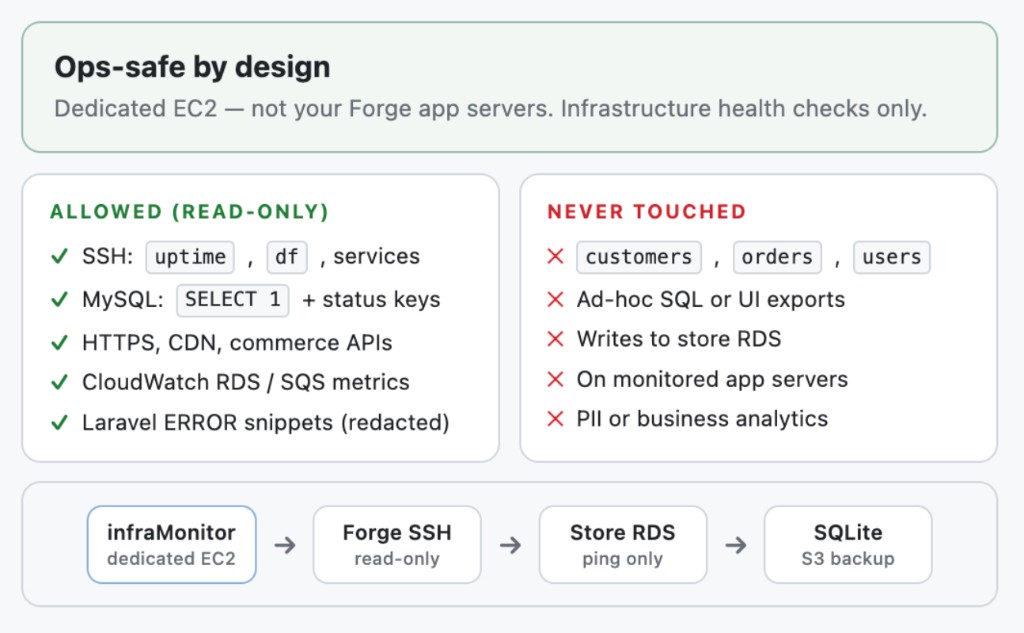
infraMonitor runs on its own EC2 instance — not on your Forge app servers. Probes are infrastructure health checks only: SELECT 1, df, service status, and allowlisted APIs. No orders, customers, or ad-hoc SQL.
Read-only SSH and MySQL checks
No writes to store RDS schemas
Monitor history in SQLite, not your app DB
Explicit blocklist for PII tables
What we watch (read-only)
Every probe is designed for health checks only — no PII, no business queries, no writes to store databases.
ProbeA dedicated monitor worker checks every store on a five-minute loop — portal SSH, APIs, and AWS metrics.
DetectFailures streak into incidents. One flaky check won’t wake anyone; sustained problems will.
Alert & reviewSlack pings the team with store links. Sign in here for live status, history, and the full incident log.
Built for ops, not data mining
Maintenance windows suppress noise during deploys. Every incident is logged with open and close timestamps — a clear audit trail when something breaks overnight.
“If the heartbeat flatlines, you’ll know before your customers do.”
TAD-family stores · Laravel Forge · AWS TAD account
Ready to check the fleet?
Sign in with your team Google account to open the live dashboard.